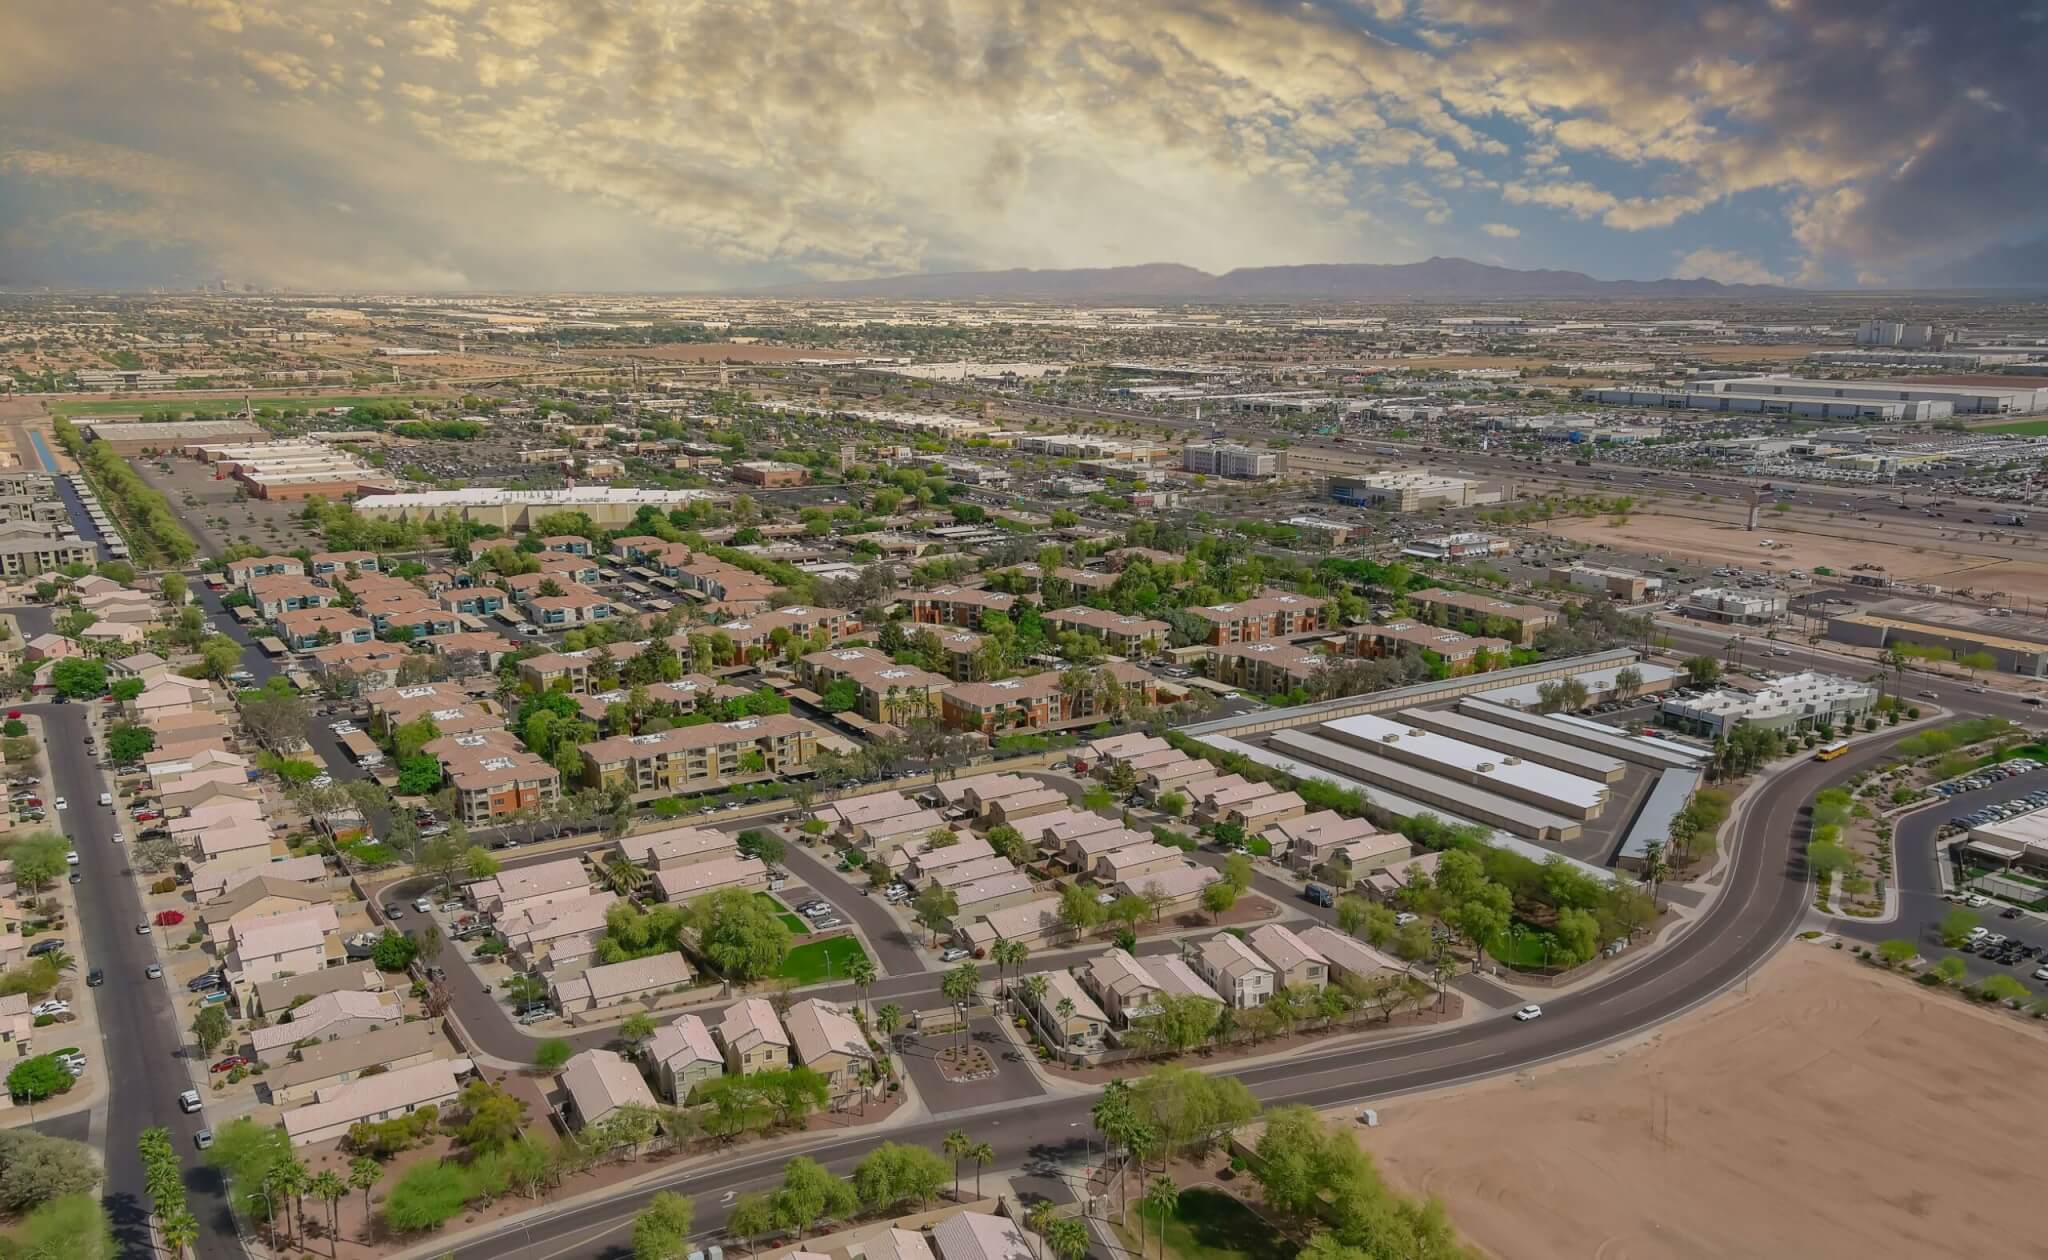
Now that Greater Phoenix is officially in a buyer’s market, many sellers will need to take a more creative approach to structuring deals and getting a transaction done. If interest rates are what’s holding a buyer back, or if they can’t otherwise obtain financing, a seller who can convert their equity into some form of financing will have an advantage. Additionally, investor buyers are buying, where the price is right…
If you’re wondering, “What is a typical buyer’s market like?”, well, there have only been three of them over the past 24 years during which the overall supply-demand index dropped below 90. (As of Nov. 25, the Cromford Index was at 86.6.) In 2022, buyers had the advantage for just 4 weeks, while the 2010 buyer’s market lasted for 15 weeks. Going back to 2006-2009, we experienced nearly 3.5 years that concluded with the Great Recession. If we take 2010 and 2022 to extrapolate, both shifted out of a seller’s market into a buyer’s market within the year and both markets saw prices decline 10-12% per square foot from the peak to the valley before prices rebounded. This year, prices per square foot peaked in April and were down 5.2% as of the end of November.
Buyer’s Market Trends
Active listings continued to rise over the course of November, stabilizing at just over 20,000 by the end of the month after rising 25% over 4 months—during which mortgage rates dropped from 7.5% to 6.1%, then bounced back to 7.0%. For historical comparison to previous buyer’s markets:
- In 2010, supply rose 20% over the course of 6 months, with 39,788 actives by November as mortgage rates declined from 5.1% to 4.1%, then bounced back to 5.0%.
- In 2022, supply skyrocketed 286% from 5,070 listings in April to 19,556 by October, as mortgage rates soared from 3.3% to 7.4%.
Based on those numbers, the buyer’s market of 2010 is more like today’s market—however, circumstances were different then as both supply and demand were 30% and 10% higher than normal, respectively. High supply was fueled by foreclosures, and high demand was fueled by cash investors. Today, both supply and demand are 11% and 23% below normal, respectively.
New listings are still at the second lowest count over the past 24 years, behind only 2023. The exception is the level of new mobile home listings, which is the highest it’s ever been, up 12% from the previous high last year. Condos and mobile homes continue to fuel increased supply, composing 23% of active listings and up 52% YOY combined. Seasonally, we expect supply to glide downward in December, as more sellers opt to wait until January to list. Most price reductions will also be put on hold until 2025.
Mortgage rates have remained stubbornly high, with 30-year loans sitting at around 6.8% as of December 9. Some mainstream headlines have suggested high mortgage rates are a result of post-election uncertainty, but judging from the stock market, it’s the opposite. The day after the election, the stock market surged to new heights, indicating optimism going forward.
Unfortunately for mortgage rates, that means fewer investors were buying bonds, pushing the 10-year yields higher and thus mortgage rates higher with them. The irony is that a strong economy—or the anticipation of it—pushes mortgage rates higher, whereas a weakening economy pushes mortgage rates lower.
Over the past three years, industry analysts have had little success predicting mortgage rates. For what it’s worth, most believe they will remain stable through the end of the year. If unemployment worsens over the next few months, rates will probably decline. If unemployment stays the same or improves, expect rates to remain elevated. In the meantime, there is one thing sellers can look forward to: the spring buying season. Historically, the last few weeks of the year are the lowest for contract activity, followed by a sharp increase from January through May. The increase is stronger in seller’s markets and weaker when buyers have the upper hand, but it increases either way.
Luxury buyer demand remains high, but increased supply is keeping prices stable. The Northeast Valley had 65% market share of all sales over $1M in 2021, but only 54% in 2024 so far as more buyers consider other regions.
Let us help you find your perfect space!
Find a Residential Property


