During a recent meeting, one of our team members brought along the June 2014 issue of The Real State—and it served as a reminder as to how much change can occur in commercial real estate in the span of a decade. Today’s biggest concerns in CRE revolve around inflation, interest rates, and pressures on the office and multifamily markets. Back in 2014, however, memories were still fresh about the financial devastation of the Great Recession. The acute pains had mostly faded. Nationally, job numbers had rebounded, although Phoenix lagged the pack, recovering just over 60% of its lost jobs by then—sitting at 7.8% unemployment compared to the US average of 6.3%. The Federal Reserve had kept the Fed Funds Rate at zero since 2008, and the first 25 basis point increase wouldn’t occur till 2015.
The headline story in our June 2014 newsletter was “Robust Activity in the Commercial Market! The commercial market is showing strong signs of stabilization, across all property classes …Investor activity/interest is robust.” While that was the 30,000-foot view of the market, a closer look at the details shows an interesting compare and contrast with today’s performance.
CRE Sector by Sector: 2014 vs. 2024
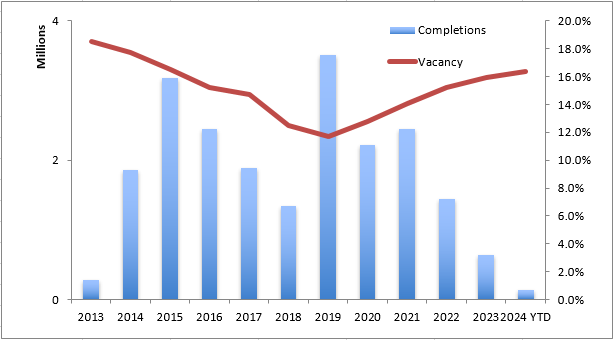
Office: At around 20%, office vacancy rates were technically not too different in 2014 from today. The push then, however, was to get numbers to hold below 20% with disciplined development, focusing on build-to-suit activity/development. The plan worked, with vacancies dropping to 12% by 2019…and then we all remember what happened in 2020 and the uncertainty that lies ahead. The average verified sales price for office sales in Q2 2014 was $143/SF, compared to today, at $162/SF.
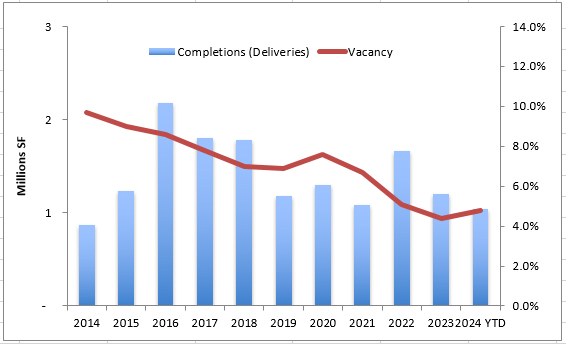
Retail: Five years after the 2008-2009 downturn, retail was still having a tough go, with vacancies around 10% and concerns about how online sales would impact brick-and-mortar locations. Few new developments hit the market during the next two years, other than infill redevelopments/repurposed projects. Aside from an upward blip during the pandemic, retail vacancies have been on a steady decline ever since—now at about 5%, making retail a surprise success story. The average verified sales price for retail sales in Q2 2014 was $138/SF, compared to today, at $213/SF.
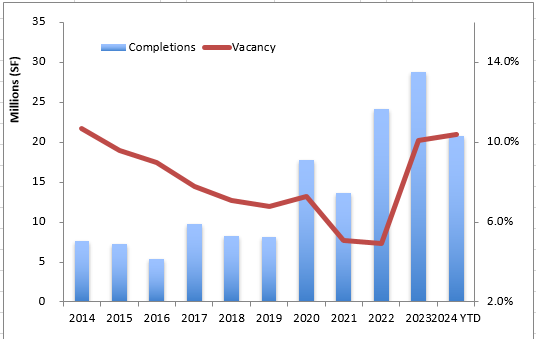
Industrial: In 2014, the Greater Phoenix industrial market was described as “relatively strong” with vacancies at levels comparable to today, around 12%. The major difference between then and now, however, is the amount of new development that has surged into the market to meet demand. Whereas less than 8 million SF of industrial space was completed in 2014, developers have been exceeding 10 million SF a quarter for almost a year—with Phoenix ranking #1 in the nation for the largest active industrial pipeline. The average verified sales price for industrial sales in Q2 2014 was $69/SF, compared to today, at $154/SF.
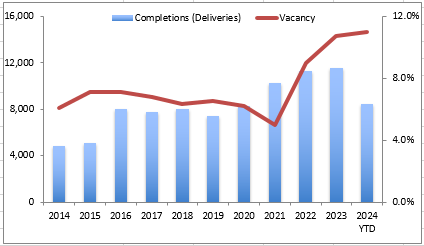
Multifamily: As with the case in the other sectors, vacancies in multifamily were suppressed in 2014 due to relatively subdued development (about 5,000 units completed) and tight lending standards that kept would-be homeowners in the rental pool. As a cursory look around the Valley will confirm, the surge in development that began in 2020-2021 has continued—and as anticipated, driven vacancies higher to around 11%. The average price per unit for multifamily sales in Q2 2014 was $62,377 per unit, compared to today, at $279,492 per unit, which is down from market peak in early 2022.
There’s no such thing as a crystal ball in CRE. Looking at the perspective of a decade’s worth of economic ups and downs illustrates how the market evolves—with plenty of surprises and sometimes counterintuitive results.
Let us help you find your perfect space!
Find a Commercial Property